Project
Vantage City OS
A live 3D map of London drawn as holograms, built on Ordnance Survey and open data
Feel free to share my work. I'd really appreciate it, because I don't tend to share it enough myself.
- Role
- Status
- Free
- 1 mm
- 0
What it is
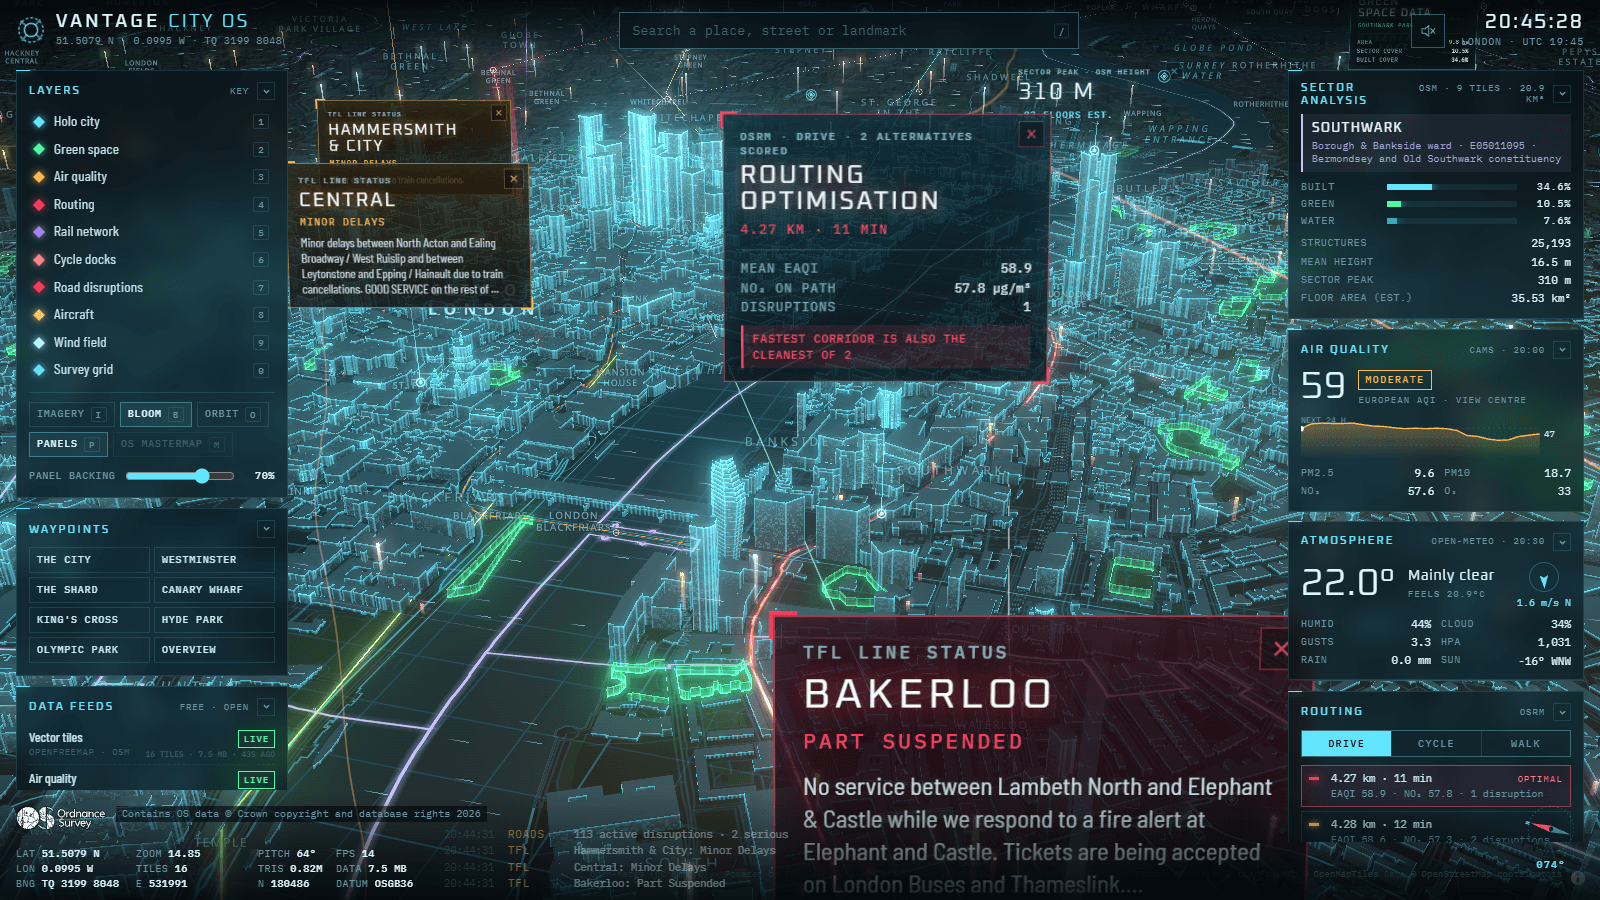
Vantage City OS is London in 3D, drawn like a hologram, with live data placed where it happens. Planes cross overhead in real time, Tube lines show their current status, road disruptions and cycle docks sit on the streets they belong to, and the air quality and weather update for whichever part of the city you're looking at.
It started with a picture of a Tony Stark style holographic city, and the question of whether something like it could be built in a browser using only free data. It can.
Live data, where it happens
TfL provides the Tube, Elizabeth line and DLR, line status, road disruptions and Santander Cycles docks. Aircraft come from open ADS-B feeds, and weather and air quality from Open-Meteo. You can click a building to scan it, search for any place, or type a grid reference.
Plan a route and it compares the alternatives on travel time, the air pollution you'd breathe along the way and any live road disruptions, then tells you which is best. Sometimes the fastest route is also the cleanest, and it says so.
Ordnance Survey
Even without an OS key it shows British National Grid references everywhere, and you can search by one, for example TQ 3004 7963. The conversion follows OS's own guide to coordinate systems, and it matches their worked example to the millimetre.
With an OS Data Hub key, OS Names adds UK place, road and postcode search, and Boundary-Line shows the borough, ward and constituency under the view, with the outlines drawn on the map. Both are running on the live site.
It's also built to use OS MasterMap buildings and OS NGD building data (use, age, materials, floors, heights, solar panels) on OS's Premium plan. Those switch themselves on when the key has access, and until then the site says exactly what's missing rather than failing quietly.
How it's drawn
The base map is MapLibre GL with OpenStreetMap data. Everything that glows is drawn by three.js on a second layer that follows the map's camera exactly, with a bloom effect for the glow.
The buildings are built in background threads from the map's own tiles, so the page stays smooth while new areas load. The floating panels are ordinary page elements bent into 3D, which keeps their text sharp as they tilt with the view.
The sound
The soundscape is synthesised in the browser with Web Audio, with no recordings at all. It follows what's on screen: traffic on the main roads in view, trains along the rail lines, jet noise that tracks the real aircraft, wind from the live weather, and a crowd murmur that rises as you get down to street level.
It starts switched off, because browsers won't play sound until you've clicked something.
How it's built
It's a static site with a few small server functions on Vercel. They sit in front of the services a browser can't call directly, and in front of every Ordnance Survey call, so the OS key stays on the server and never reaches a visitor. They also cache answers, so repeat visits don't use up the free allowances.
The code is public on GitHub, and it was written with Claude Code.
Built with
Next
Custom camera detectors, trained in the browser from a few example photos